Building Self-Healing Infrastructure on AWS with Terraform
The user just wants to format the markdown content — no file creation needed. Here's the cleaned-up version:
The Problem
It's 3 AM. Your web server crashes. Your monitoring sends you an alert. You wake up, SSH into the server, restart the service, and go back to sleep. Sound familiar?
What if AWS could detect the problem, fix it automatically, and just send you an email saying "something broke, but we already fixed it"?
That's exactly what I built.
What This Project Does
This is a fully automated self-healing infrastructure on AWS. An EC2 instance runs Apache HTTPD, and when the service goes down — whether from a crash, high CPU, or a status check failure — the system:
- Detects the failure via CloudWatch Alarms
- Alerts via SNS email notification
- Remediates automatically via SSM Automation (restart httpd → check status → reboot if needed)
- Verifies recovery and sends a follow-up OK email
No human intervention required. The entire loop runs in under 5 minutes.
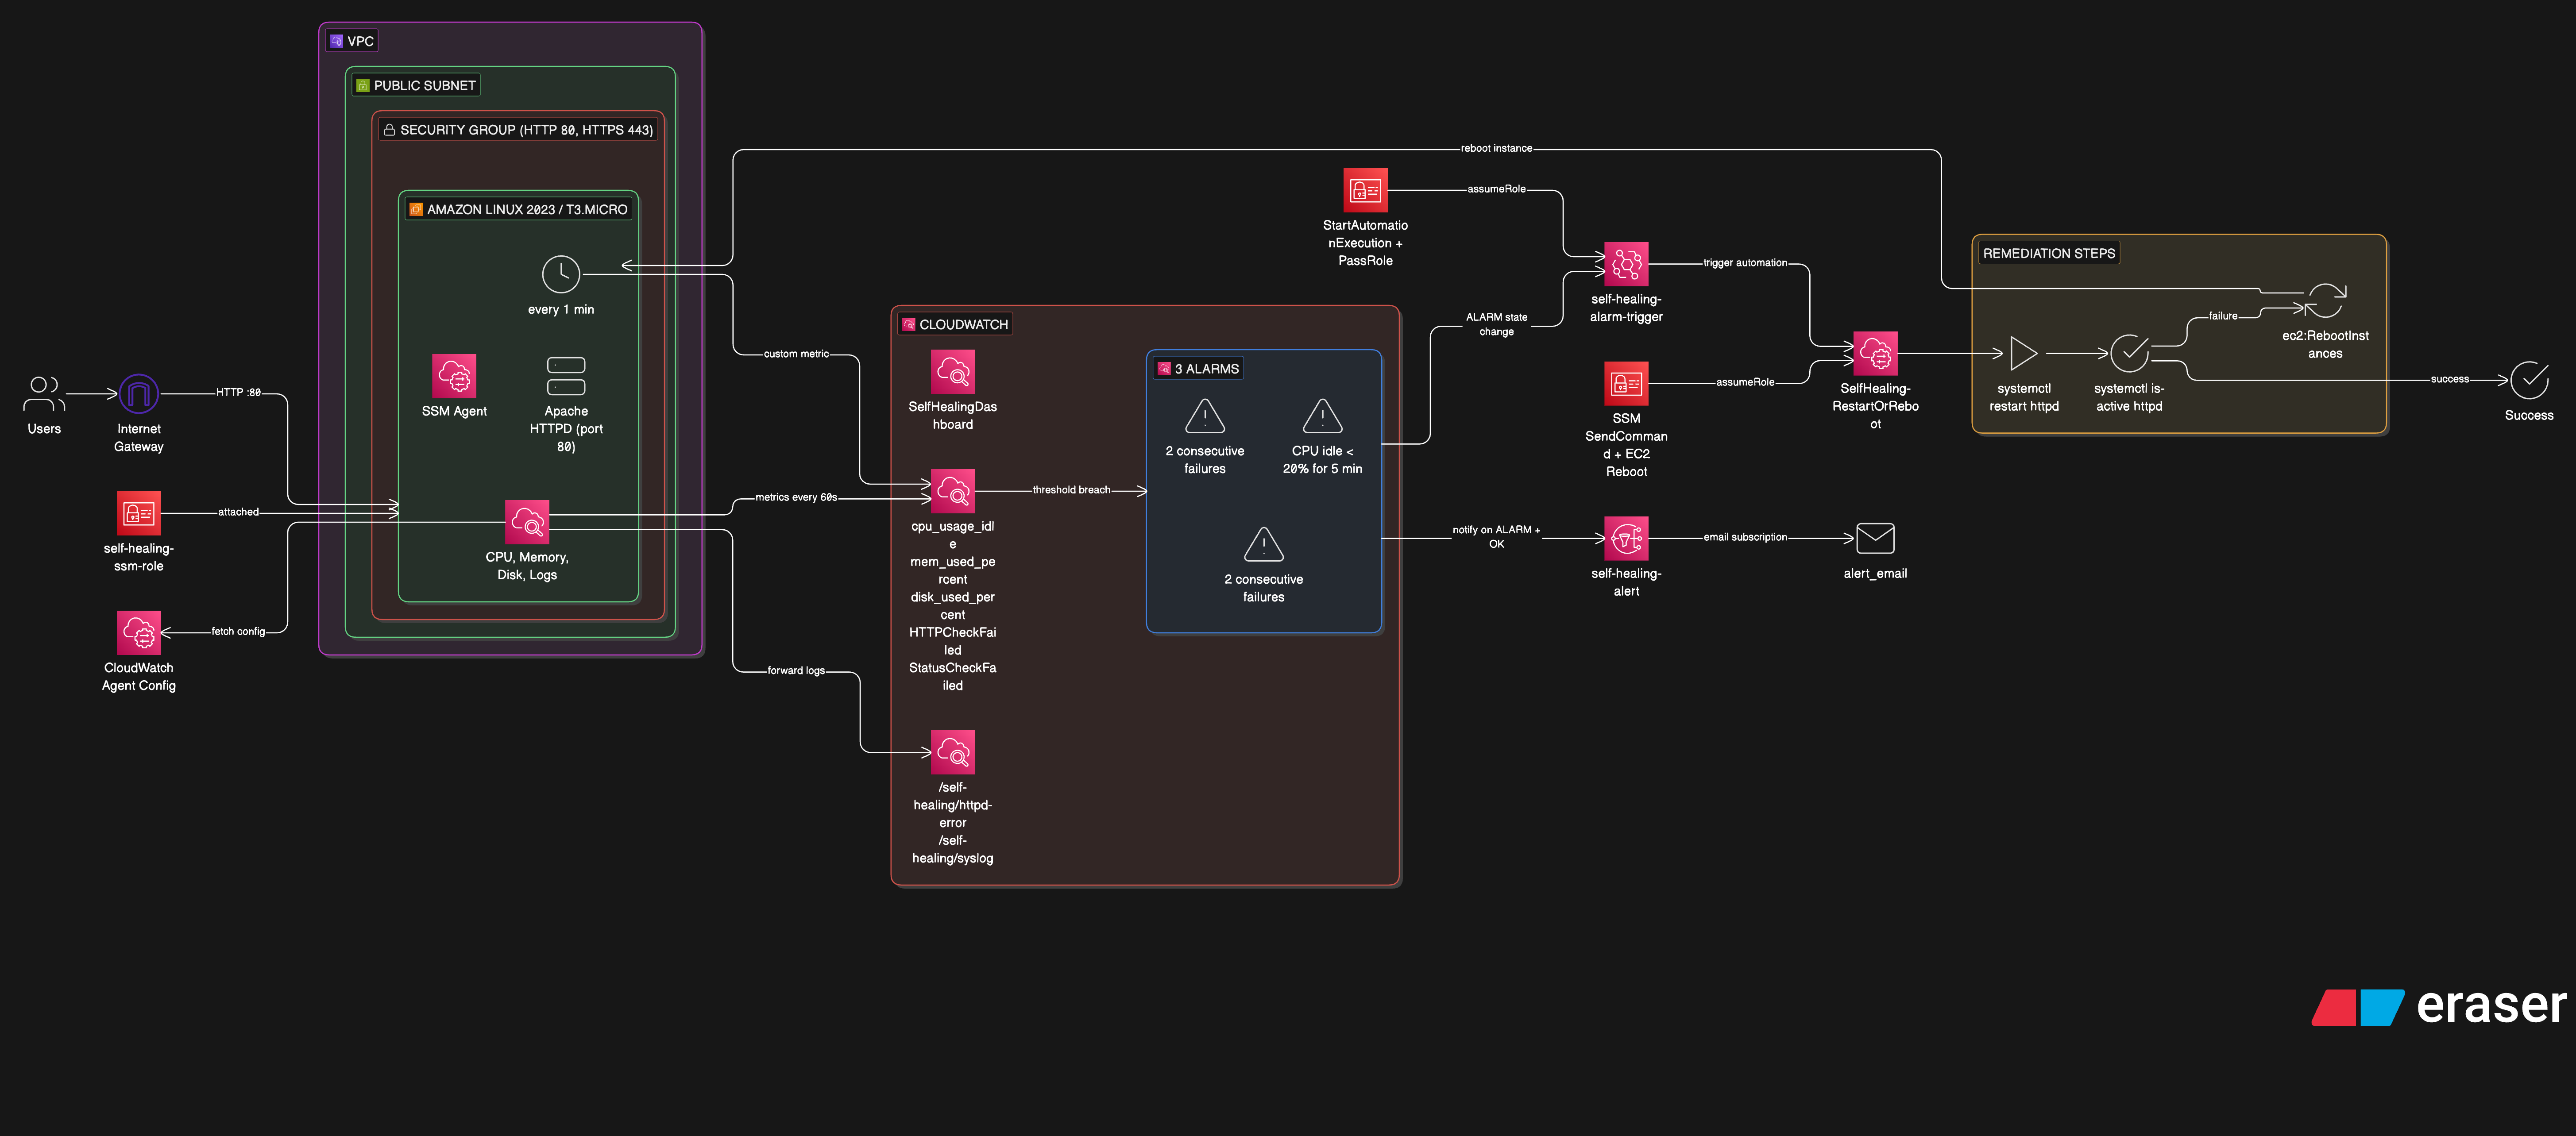
Architecture
EC2 (httpd + CloudWatch Agent + Health Check Cron)
     │
     ├── metrics ──→ CloudWatch Alarms
     │                    │
     │                    ├──→ SNS ──→ Email (ALARM + OK)
     │                    │
     │                    └──→ EventBridge ──→ SSM Automation
     │                                            │
     │                                            ├─ Step 1: restart httpd
     │                                            ├─ Step 2: check status
     │                                            └─ Step 3: reboot EC2 (last resort)
     │
     └── recovers ──→ alarm returns to OK
AWS Services Used
| Service | Role |
|---|---|
| EC2 | Amazon Linux 2023 running Apache HTTPD |
| CloudWatch Agent | Collects CPU, memory, disk metrics and forwards logs |
| CloudWatch Alarms | Three alarms monitoring HTTP health, CPU usage, and EC2 status checks |
| CloudWatch Dashboard | Real-time visibility with 7 widgets |
| EventBridge | Routes alarm state changes to SSM Automation |
| SSM Automation | Executes a multi-step runbook to restart or reboot |
| SSM Parameter Store | Stores CloudWatch Agent configuration |
| SNS | Email notifications for alarm and recovery events |
| IAM | Least-privilege roles for EC2, SSM, and EventBridge |
Terraform Module Structure
infra/
├── main.tf                    # Module orchestration
├── modules/
│   ├── networking/            # VPC, subnet, IGW, security group
│   ├── iam/                   # EC2 role, instance profile
│   ├── compute/               # EC2 instance, key pair
│   ├── monitoring/            # CW agent config, alarms, dashboard
│   ├── notification/          # SNS topic + email subscription
│   └── remediation/           # SSM runbook, EventBridge rule
└── scripts/
    └── cloudwatch_ssm.sh      # EC2 bootstrap script
Each module has a single responsibility. The main.tf wires them together — networking outputs feed into compute, compute outputs feed into monitoring, monitoring outputs feed into remediation.
The SSM Automation Runbook
The runbook SelfHealing-RestartOrReboot has three steps:
Step 1 — Restart httpd: Runs systemctl restart httpd via SSM RunCommand. If it fails, continues to Step 2.
Step 2 — Check httpd status: Runs systemctl is-active httpd. If httpd is active, healing is complete. If it fails, escalates to Step 3.
Step 3 — Reboot EC2 (last resort): Calls the EC2 RebootInstances API. The instance reboots, user data runs again, and everything comes back online.
This escalation pattern — try the least disruptive fix first, then escalate — is a common pattern in production incident response. This project automates it.
The Custom Health Check
CloudWatch doesn't monitor HTTP application health by default. A simple bash script runs every minute via cron:
TOKEN=$(curl -s -X PUT "http://169.254.169.254/latest/api/token" \
  -H "X-aws-ec2-metadata-token-ttl-seconds: 300")
INSTANCE_ID=$(curl -s -H "X-aws-ec2-metadata-token: $TOKEN" \
  http://169.254.169.254/latest/meta-data/instance-id)

HTTP_CODE=$(curl -s -o /dev/null -w "%{http_code}" http://localhost/)

if [ "$HTTP_CODE" -eq 200 ]; then VALUE=0; else VALUE=1; fi

aws cloudwatch put-metric-data \
  --namespace "SelfHealingInfra" \
  --metric-name "HTTPCheckFailed" \
  --dimensions "InstanceId=$INSTANCE_ID" \
  --value "$VALUE"
It hits localhost, checks the HTTP status code, and pushes a custom metric HTTPCheckFailed (0 = healthy, 1 = down) to CloudWatch. The alarm watches this metric and fires after 2 consecutive failures.
Note: This uses IMDSv2 (token-based metadata) — the AWS-recommended approach over the older IMDSv1.
Three Alarms, One Runbook
| Alarm | What It Watches | Threshold |
|---|---|---|
| HTTP Check Failed | Custom HTTPCheckFailed metric | > 0 for 2 min |
| High CPU | cpu_usage_idle from CW Agent | < 20% for 5 min |
| EC2 Status Check | AWS native StatusCheckFailed | > 0 for 2 min |
All three alarms are wired to the same EventBridge rule. Any alarm entering ALARM state triggers the same SSM runbook — whether the web server crashes, the CPU spikes, or the instance itself has issues.
One important configuration: treat_missing_data = "breaching". If the CloudWatch Agent crashes and stops sending metrics, the alarm still fires. Missing data means something is wrong.
Testing It
Simulate HTTP failure:
sudo systemctl stop httpd
Within 3–4 minutes: alarm fires → email arrives → SSM restarts httpd → alarm returns to OK → recovery email arrives. All automatic.
Simulate unrepairable failure:
sudo mv /usr/sbin/httpd /usr/sbin/httpd.bak
sudo systemctl stop httpd
Now the restart fails, so SSM escalates to rebooting the entire instance.
Lessons Learned
CloudWatch Agent dimensions matter. The agent publishes metrics with dimensions like host, cpu, device. If your alarms and dashboard query different dimensions, you get "No data available." Use append_dimensions and aggregation_dimensions to normalize everything to InstanceId.
SSM Session Manager > SSH. No need to manage SSH keys or open port 22. SSM sessions work through the IAM role — more secure, fully audited.
Cron needs cronie on AL2023. Amazon Linux 2023 doesn't ship with crond installed. Add yum install -y cronie to the bootstrap script.
IMDSv2 is the way. The older ec2-metadata command isn't always available. The token-based IMDS endpoint works everywhere and is more secure.
What's Next
The detect → alert → remediate → verify pattern extends well beyond EC2:
- ECS tasks that restart failed containers
- Lambda functions triggered by CloudWatch alarms for custom remediation logic
- Auto Scaling Groups that replace unhealthy instances entirely
- Multi-region failover using Route 53 health checks